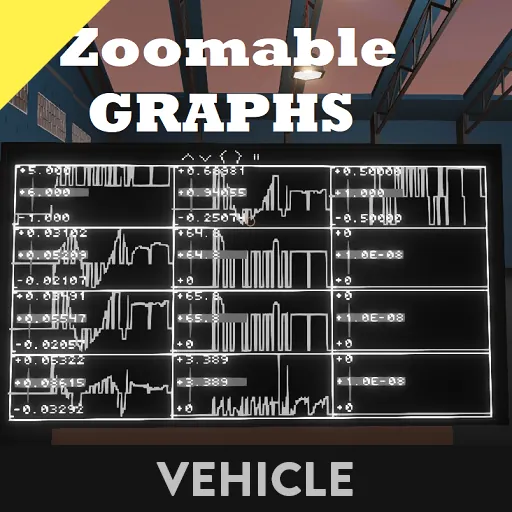
Collects and efficiently renders multiple data channels into synchronized graphs. Great for debugging LUA scripts or analyzing precise timings between components.
Features:
- Configurable number of graphs (1,2,3,4,6,8,9,12)
- Pause and zoom
- Click to add time markers to show in all graphs
- Configurable capacity for rotating buffer
- Automatically fits to the displayed data
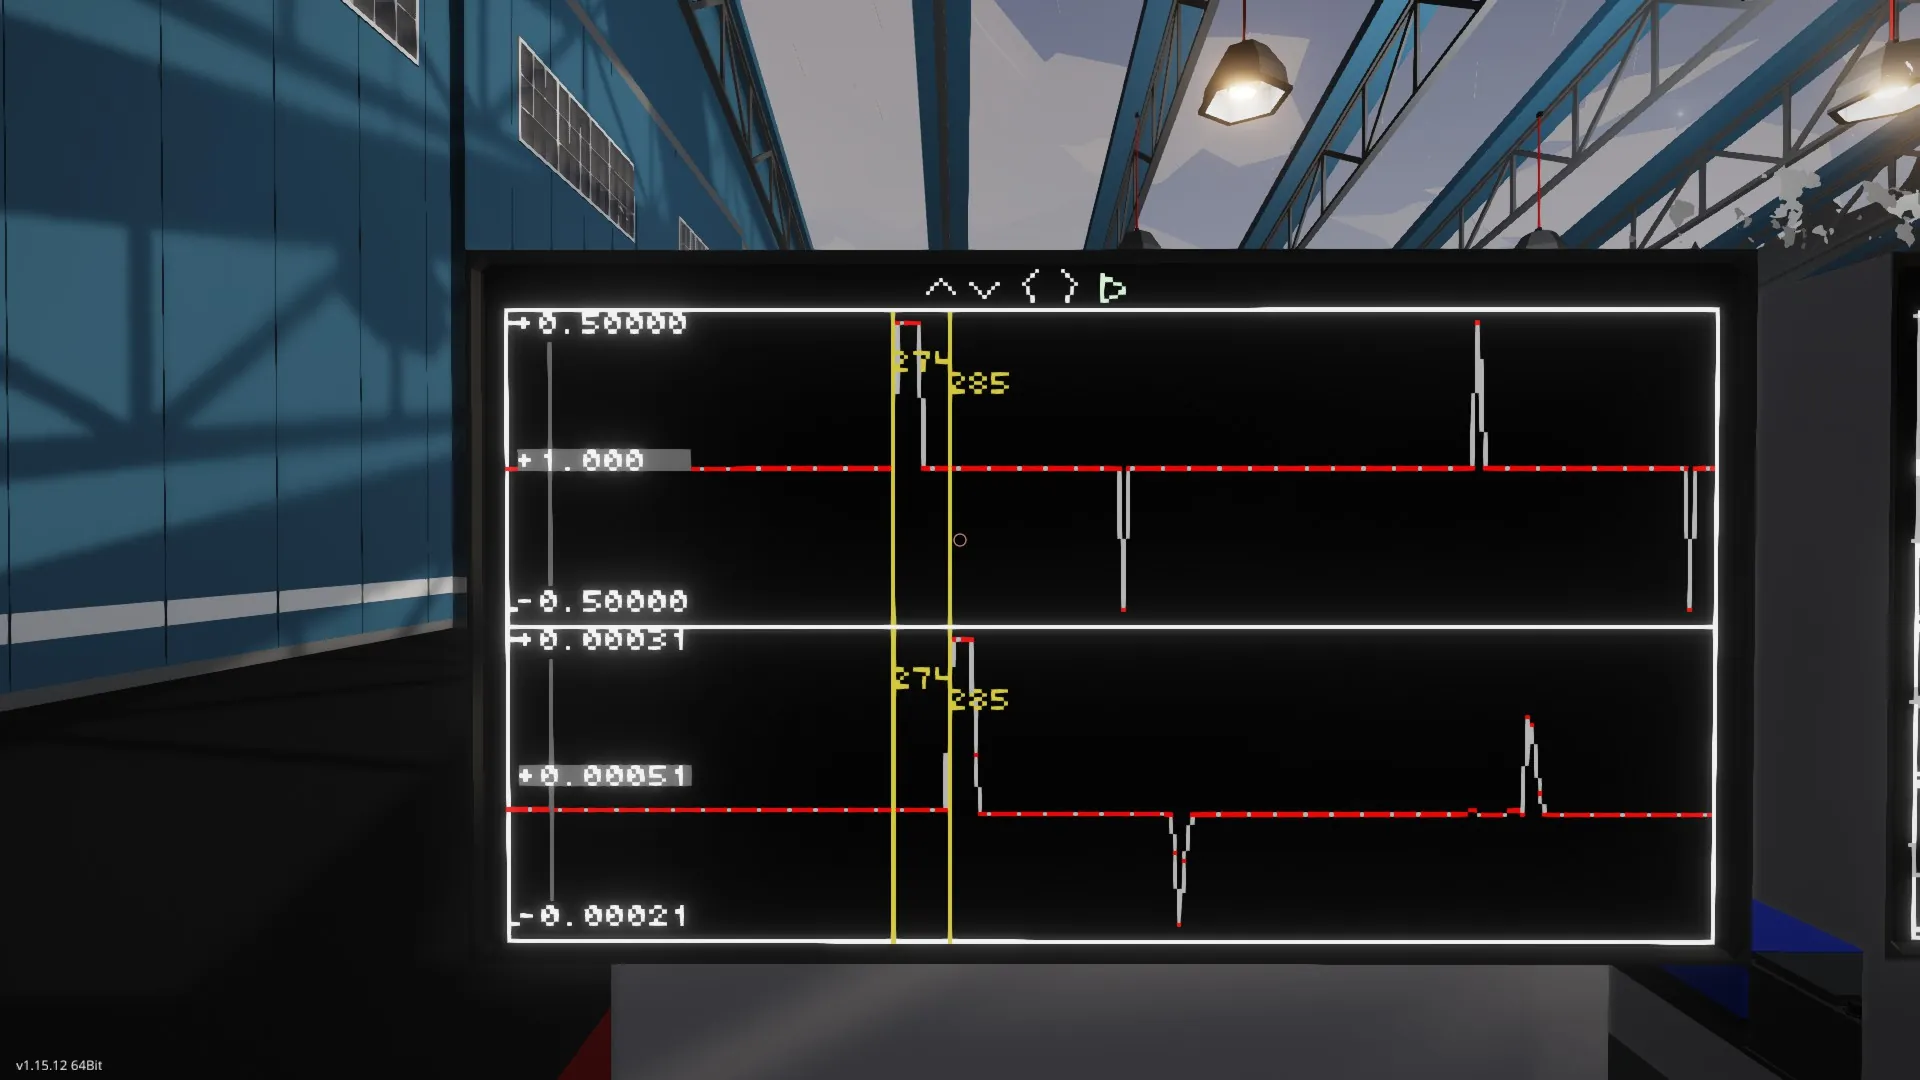
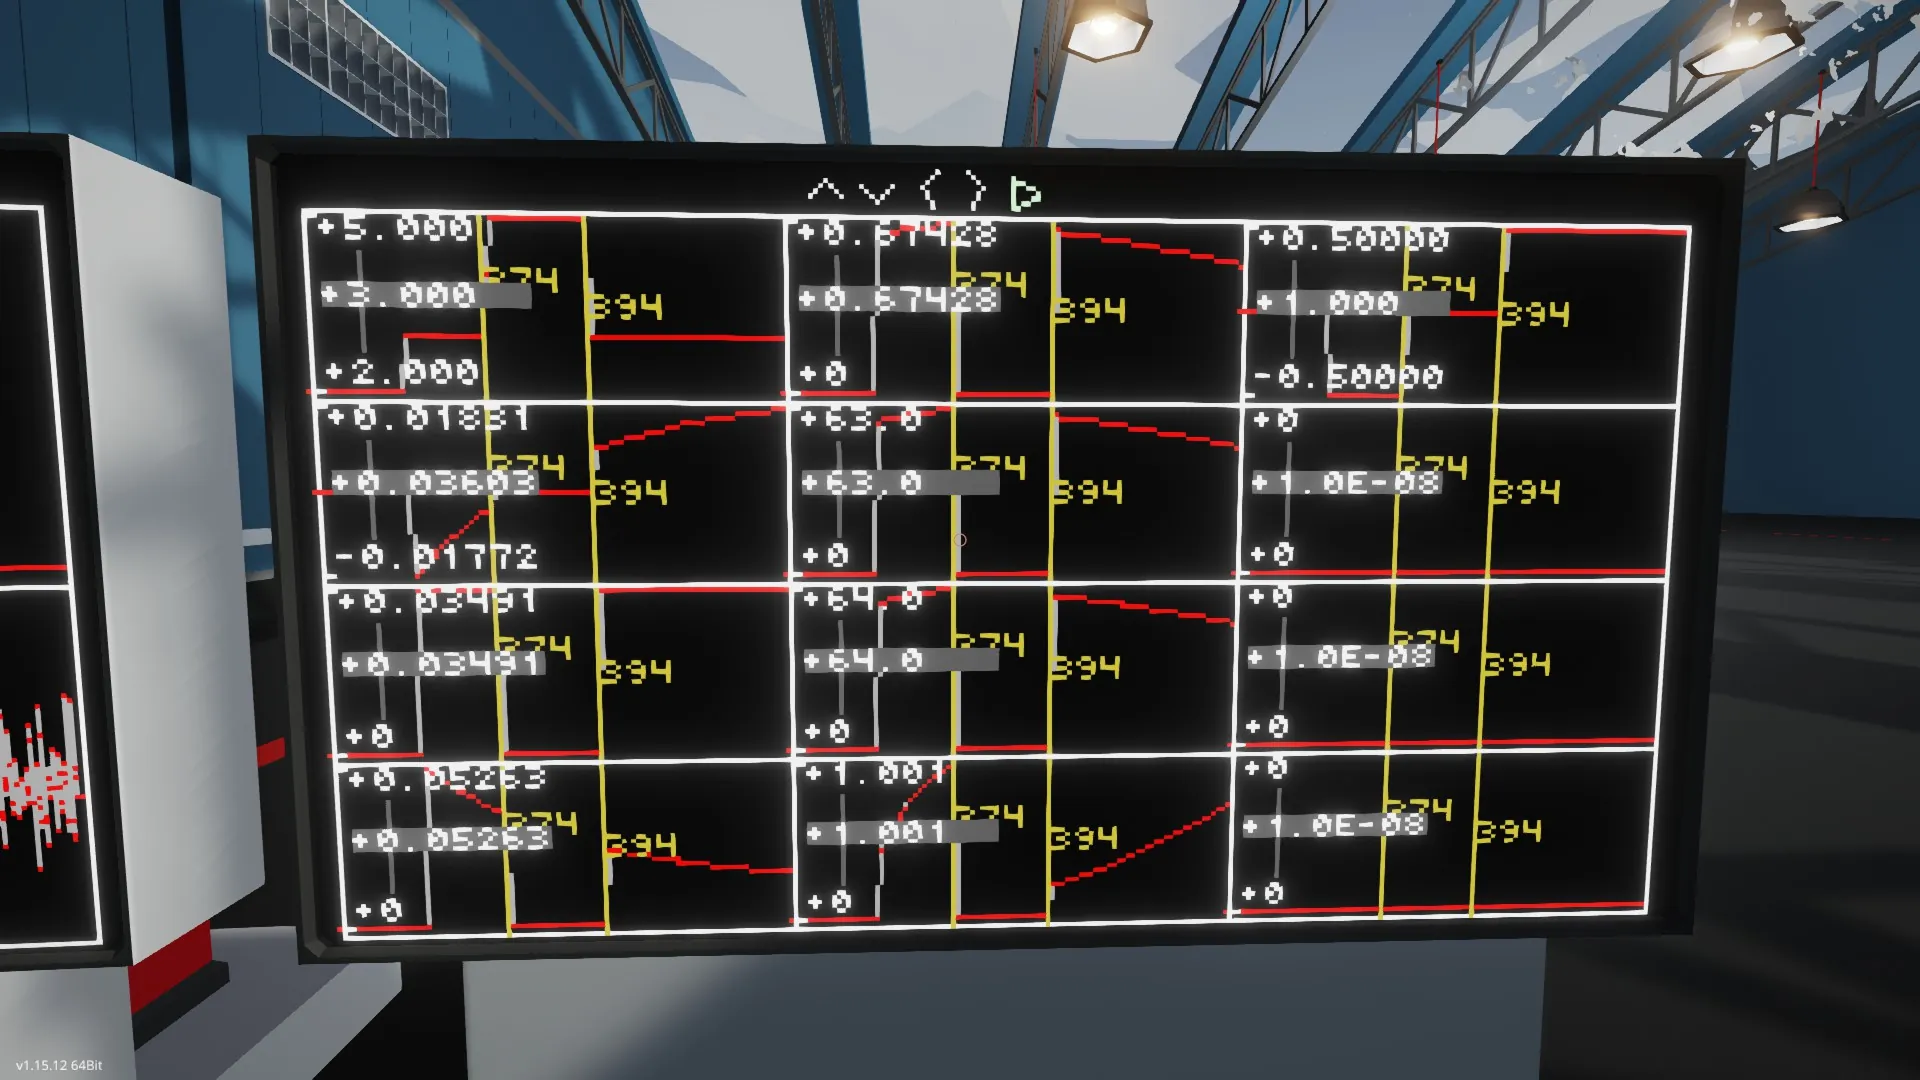
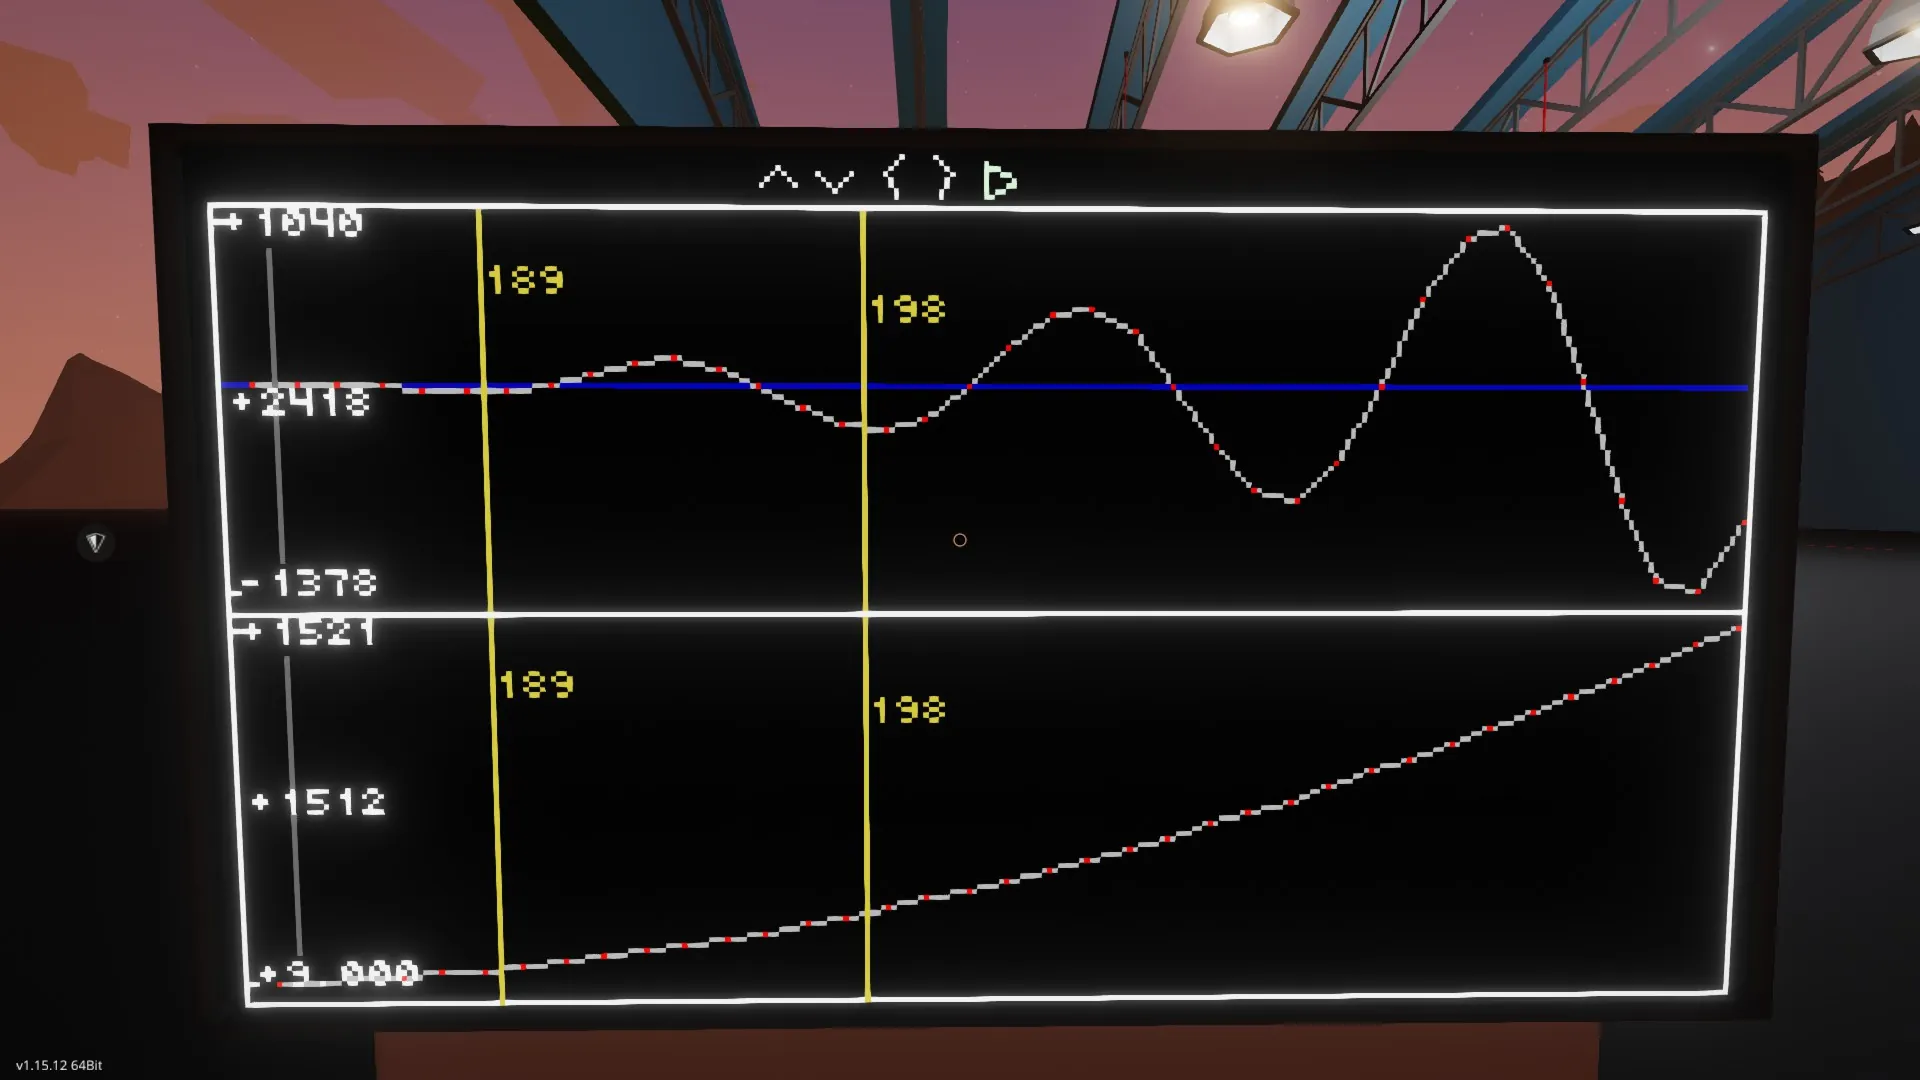
The red points are individual data points. When you see only gray, you're looking at ranges of data points (rendered as vertical lines from the lowest point in a data range to the highest). The numbers on the left of each graph are the largest and smallest values in the rendered dataset (top and bottom respectively), and the difference between them (middle). If you see a blue horizontal line, that's y=0 (not shown in these screenshots because they're old).
Don't forget to turn it on!